
General information about Radeon RX 7900 GRE
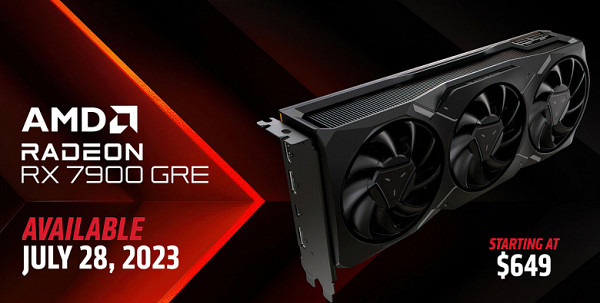
Following the release of the Radeon RX 7700 XT and Radeon RX 7800 XT last year, AMD announced that there are no further plans for graphics cards in the current lineup, thus ending the introduction of new products to the market. However, a gap appeared between the Radeon RX 7800 XT and Radeon RX 7900 XT models, which seemed to require filling with a similar video card, for example, the Radeon RX 7900 (without additional indexes). AMD’s tactics in this case were clear: at the end of July last year, the Radeon RX 7900 GRE (Golden Rabbit Edition) card appeared on the Asian market.
Although nothing prevented AMD from releasing the Radeon RX 7900 GRE in other global markets, this only happened this year. The suffix «Golden Rabbit Edition» was chosen because 2023, according to the Eastern calendar, was the year of the rabbit, and in Chinese culture, the golden rabbit is one of the important positive symbols. Interestingly, AMD retained the GRE name even for the global launch on February 27, 2024, when, according to the eastern calendar, the Year of the Dragon began.
The model we are reviewing today from AMD is based on their most powerful graphics processor at the moment — Navi 31, which belongs to the modern RDNA3 architecture. It has a number of advantages over previous models, including improved performance and efficiency thanks to the use of a 5-nanometer manufacturing process.
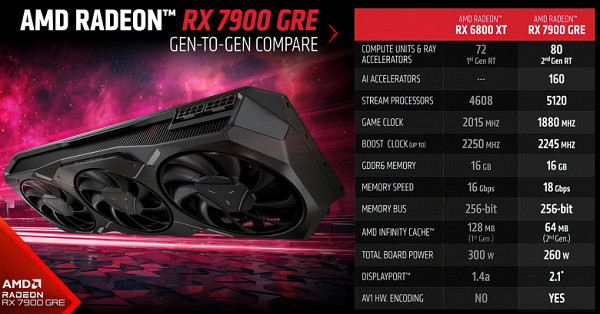
The Navi 31 GPU with chiplet design is the basis for this model. It features six dies with 16MB of Infinity Cache and a 64-bit memory controller. However, compared to the flagship Radeon RX 7900 XTX, which uses a full GPU with 6144 stream processors, the Radeon RX 7900 GRE reduces the number of stream processors to 5120.
The video card is equipped with 16 GB of GDDR6 memory with a 256-bit bus and provides a total bandwidth of 576 GB / s at an effective frequency of 18 GHz. Its power consumption is 260 W, which makes it slightly more energy efficient compared to other models in the line.
While the Radeon RX 7900 GRE is primarily aimed at 2560x1440 resolutions, it is also capable of delivering strong performance at 4K resolutions in many games. It also supports FSR technology for increased performance with minimal loss of image quality.
This graphics card is an excellent alternative to previous generation flagship models and is suitable for a wide range of games at various resolutions, including 4K, except for the most demanding ray-traced games.
AMD has decided to initially limit the release of the Radeon RX 7900 GRE to the Chinese market only, introducing it there at the end of July 2023. This decision was likely driven by the unique requirements and preferences of the Chinese market segment. Perhaps AMD saw potential in the specific needs and preferences of Chinese consumers, which were different from other regions.
However, in early 2024, AMD decided to release the Radeon RX 7900 GRE in other global markets. This is likely due to changes in the GPU market. By 2024, stocks of previous generation graphics cards such as the Radeon RX 6000 began to dry up, creating space for new models. Nvidia also introduced updated models during this time, leading to increased competition in the $400 to $600 price range. The release of the Radeon RX 7900 GRE in these markets allowed AMD to carve out a niche and offer an alternative to existing Nvidia models such as the GeForce RTX 4070 and GeForce RTX 4070 Ti.
Thus, AMD's decision to release the Radeon RX 7900 GRE to global markets in early 2024 was likely driven by changes in the competitive landscape and the opportunity to fill the gap between models in the $400 to $600 price range.
| Radeon RX 7900 GRE graphics accelerator | |
|---|---|
| Chip code name | Navi 31 XL |
| Production technology | 5 nm and 6 nm (N5 and N6 TSMC) |
| Number of transistors | 57.7 billion |
| Core area | 529 mm² |
| Architecture | unified, with an array of processors for stream processing of any type of data: vertices, pixels, etc. |
| DirectX hardware support | DirectX 12 Ultimate, supporting Feature Level 12_2 |
| Memory bus | 256-bit: 4 (out of 6) independent 64-bit memory controllers with GDDR6 support |
| GPU frequency | up to 2245 MHz |
| Computing blocks | 80 (out of 96) CUs consisting of a total of 5120 (out of 6144) ALUs for integer and floating point calculations (INT4, INT8, INT16, FP16, FP32 and FP64 formats supported) |
| Ray tracing blocks | 80 (out of 96) Ray Accelerator blocks for calculating the intersection of rays with triangles and BVH bounding volumes |
| Texturing blocks | 320 (out of 384) texture addressing and filtering units with support for FP16/FP32 components and support for trilinear and anisotropic filtering for all texture formats |
| Raster Operation Blocks (ROPs) | 20 (out of 24) wide ROP blocks of 160 (out of 192) pixels with support for various anti-aliasing modes, including programmable ones and for FP16/FP32 frame buffer formats |
| Monitor support | support for HDMI 2.1b and DisplayPort 2.1 interfaces |
| Radeon RX 7900 GRE Reference Graphics Card Specifications | |
|---|---|
| Core Clock (Gaming/Turbo) | 1880/2245 MHz |
| Number of universal processors | 5120 |
| Number of texture blocks | 320 |
| Number of blending blocks | 160 |
| Effective memory frequency | 18 GHz |
| Memory type | GDDR6 |
| Memory bus | 256 bit |
| Memory | 16 GB |
| Memory Bandwidth | 576 GB/s |
| Compute Performance (FP32) | up to 46.0 teraflops |
| Theoretical maximum fill rate | 359 gigapixels/s |
| Theoretical texture sampling rate | 718 gigatexels/s |
| Tire | PCI Express 4.0 x16 |
| Connectors | one HDMI 2.1b, two DisplayPort 2.1 and one USB Type C |
| Energy consumption | up to 260 W |
| Additional food | two 8-pin connectors |
| Number of slots occupied in the system case | 2.5(3) |
| Recommended price | $549 ($649 for China in 2023) |
The name of the new video card from AMD, Radeon RX 7900 GRE, differs from the previously accepted standard, since the «GRE» suffix is new and has not been used before. It would be logical to call this model simply Radeon RX 7900 to match the established line and make it easier for the consumer to perceive. In this case, the new video card occupies a position between the Radeon RX 7800 XT and Radeon RX 7900 XT, so using a suffix would be unnecessary.
At the beginning of sales in China, the recommended price of the Radeon RX 7900 GRE was $650. However, upon entering the world market, the price was reduced to $550. This is due to price reductions for previous models, such as the Radeon RX 7800 XT and Radeon RX 7900 XT, as well as the emergence of competitive solutions from Nvidia, such as the GeForce RTX 4070 and GeForce RTX 4070 Ti. AMD's commitment to adapting the prices of its products to changing market conditions has allowed it to reduce the price of the Radeon RX 7900 GRE and make it more competitive.
The Radeon RX 7900 GRE's performance makes it an ideal choice to bridge the gap between the Radeon RX 7800 XT and Radeon RX 7900 XT. It competes successfully with similar models from Nvidia, such as the GeForce RTX 4070 Ti and GeForce RTX 4070 Super, thanks to its 16 GB of video memory, which is an advantage over its competitors. Despite some performance limitations when using hardware ray tracing, the Radeon RX 7900 GRE offers the best price/performance ratio in its market segment.
With 16 GB of video memory and a new PCB, the Radeon RX 7900 GRE is a modern and future-proof solution. With its energy efficiency, excellent performance and support for advanced technologies, it can meet the needs of the most demanding users in the field of gaming and graphics.
Architecture Features
The RDNA3 graphics architecture was discussed in detail in the previous review of the Radeon RX 7900 XT. In this article we will briefly recall the main innovations of this architecture. RDNA3 is an improved version of the previous RDNA2 architecture with several significant changes.
One of the key innovations is the ability to compute two instructions simultaneously in compute units, which improves resource efficiency. Optimizations have also been made to better utilize available resources and support for new mathematical formats, which improves performance.
An important improvement is also the reworking of ray tracing accelerators, which improves their performance. However, while improvements in this area have been noticeable, they still lag behind similar solutions from Nvidia.
Thanks to new artificial intelligence acceleration units that redistribute resources to perform matrix calculations, productivity in this area has increased several times. This significantly increases work efficiency in artificial intelligence tasks.
The Radeon RX 7900 GRE graphics card is based on the Navi 31 GPU, which is the weakest modification of this architecture. The GPU is manufactured on the 5nm EUV process and contains all the main blocks of the GPU. The total GPU area is approximately 525 mm², which is significantly larger than competing solutions from Nvidia.
So, the Radeon RX 7900 GRE combines the advantages of the RDNA3 architecture with high performance and efficiency in a wide range of tasks, which makes it a competitive solution in the video card market.
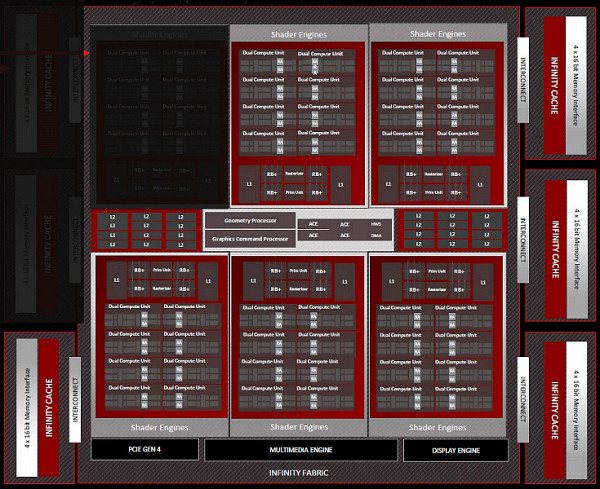
The GPU logic in the Radeon RX 7900 GRE has been modified by removing several CUs from the main GCD chiplet, as well as deactivating a pair of six MCD chiplets. As a result of this modification, the video card received 5120 stream processors, 320 texturing units, 160 AI acceleration units and 80 hardware ray tracing acceleration units.
Some ROP units were also disabled, reducing their number from 192 to 160. As for the memory subsystem, the Radeon RX 7900 GRE has a 256-bit memory bus and 64 MB of Infinity Cache. Although the effective video memory frequency is 18 GHz, which is lower than the competition, the throughput reaches 576 GB/s, which exceeds the competition.
It's important to note that AMD has introduced the ability to overclock video memory in the Radeon Adrenalin 24.3.1 driver, which significantly improves the performance of the Radeon RX 7900 GRE and brings it closer to more expensive models.
As for architectural features, the Radeon RX 7900 GRE uses an improved subsystem for displaying information on displays and encoding video data. Support for video encoding in the AV1 and SmartAccess Video format opens up new possibilities for using the video core in Ryzen 7000 processors.
It's also worth noting that the Radeon RX 7900 GRE supports DisplayPort 2.1 connectors with UHBR 10 and UHBR 13.5 data rates, which provides high throughput for connecting 4K displays with refresh rates up to 240 Hz without using video stream compression.
Preliminary Performance Assessment
Let's take a look at the specs of several current-generation AMD graphics cards, including models based on the Navi 31 and Navi 32 GPUs, as well as a roughly equivalent solution from the previous generation, the RX 6800 XT. Based on their theoretical characteristics, we can estimate how much the Radeon RX 7900 GRE will differ in performance from previous models and the current top and main models of the line.
| Video card model | RX 7900XT | RX 7900 GRE | RX 7800XT | RX 6800XT |
|---|---|---|---|---|
| GPU model | Navi 31XT | Navi 31 XL | Navi 32XT | Navi 21XT |
| Transistors, billion | 57.7 | 57.7 | 28.1 | 26.8 |
| Number of ALUs | 5376 | 5120 | 3840 | 4608 |
| Number of TMUs | 336 | 320 | 240 | 288 |
| Number of ROP blocks | 192 | 160 | 96 | 128 |
| Game frequency, MHz | 2025 | 1880 | 2124 | 2015 |
| Turbo frequency, MHz | 2400 | 2245 | 2430 | 2250 |
| Computing power FP32, tflops | 51.5 | 46 | 37.3 | 20.7 |
| Texturing speed, Gtex/s | 804 | 718 | 583 | 648 |
| Fill rate, Gpix/s | 460 | 359 | 233 | 288 |
| Video memory capacity, GB | 20 | 16 | 16 | 16 |
| Infinity Cache volume, MB | 80 | 64 | 64 | 128 |
| Video memory frequency, GHz | 20 | 18 | 19.5 | 16 |
| Video memory bus, bit | 320 | 256 | 256 | 256 |
| Bandwidth, GB/s | 800 | 576 | 624 | 512 |
| Energy consumption, W | 300 | 260 | 263 | 300 |
| Recommended price, $ | 899 | 549 (649) | 499 | 649 |
In terms of theoretical characteristics, the Radeon RX 7900 GRE differs significantly from the RX 7900 XT and RX 7800 XT. Despite the slight difference in the number of ALUs (5120 versus 5376 for the RX 7900 XT), the main cutback affects the memory subsystem. The RX 7900 XT, for example, uses 20 GB of memory with a 320-bit bus and an effective frequency of 20 GHz, giving it a significant advantage in bandwidth. Meanwhile, the RX 7900 GRE has only 16 GB of memory with a 256-bit bus and a frequency of 18 GHz.
AMD has also reduced the turbo and game clocks for the GRE model, which helps improve power efficiency. This allowed the RX 7900 GRE to consume 3 W less than the RX 7800 XT. GRE's theoretical compute performance reaches 46 teraflops for FP32 operations, which is 23% higher than the RX 7800 XT, but 11% lower than the RX 7900 XT.
When it comes to gaming performance, the RX 7900 GRE falls roughly between the RX 7900 XT and RX 7800 XT. This is due to the balance between compute and texture performance, given differences in the number of execution units and GPU frequency.
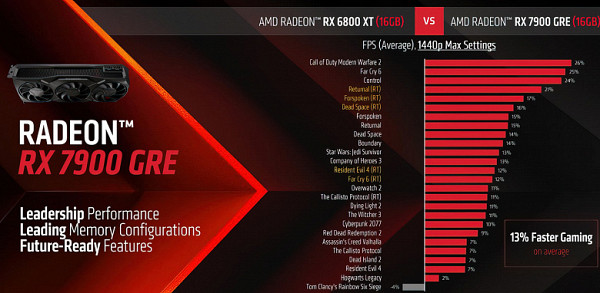
AMD compares the RX 7900 GRE primarily to the previous generation RX 6800 XT. However, according to theoretical data, GRE is closer to the RX 6900 XT and RX 6950 XT, which allows gaming at 2560x1440 resolution at maximum settings with ray tracing. In light of this, the GRE is significantly ahead of the RX 6800 XT, which was introduced three years ago, while maintaining a similar amount of video memory.
At $550, the RX 7900 GRE costs 10% more than the RX 7800 XT but offers comparable or better performance. It's excellent value for money, especially considering new features like AV1 video encoding and DisplayPort 2.1 support.
Compared to its Nvidia competitors, the RX 7900 GRE takes aim at the RTX 4070 and RTX 4070 Super, delivering superior rasterization performance. However, Nvidia takes the lead when it comes to ray tracing, where its graphics cards are more efficient thanks to dedicated tracing units.
Thus, the RX 7900 GRE represents an attractive solution with good price/performance ratio, especially for those who prefer rasterization over ray tracing in games. However, for those who value high ray tracing performance, it may be preferable to choose the more expensive solutions from Nvidia.
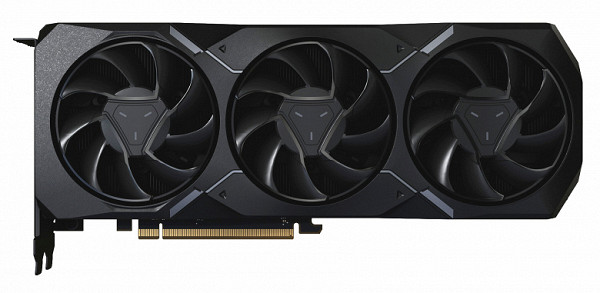
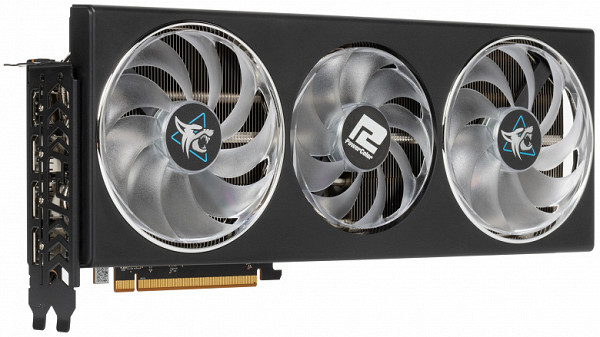
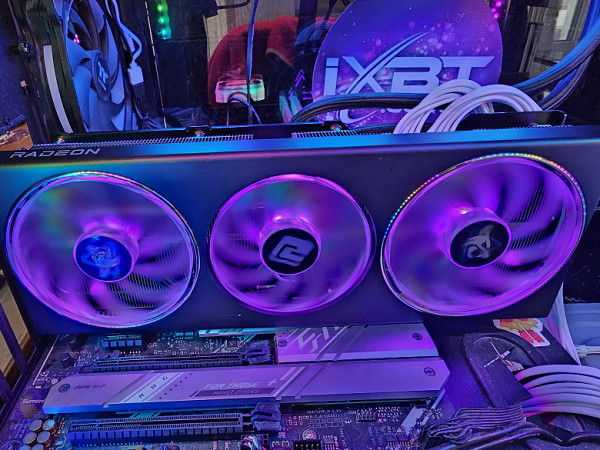
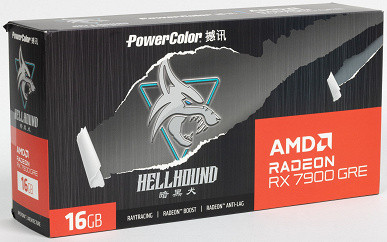
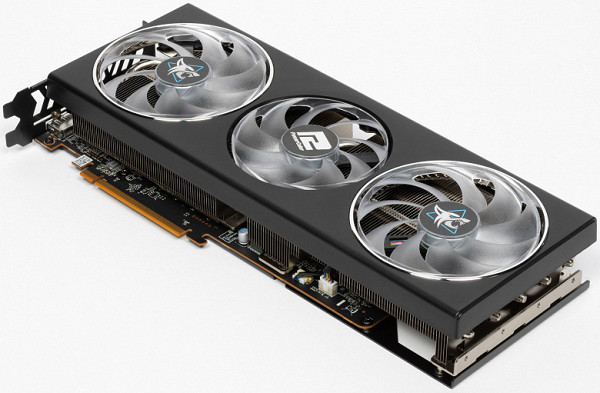
PowerColor Radeon RX 7900 GRE Hellhound 16 GB video card
TuL Corporation, also represented under the PowerColor brand, is a manufacturer of video cards for computers. Founded in 1997, the company initially partnered with Nvidia to produce graphics cards based on their GeForce GPUs. However, after reorganization in 2002, they completely switched to the production of accelerators with GPUs from ATI/AMD Radeon.
TuL Corporation is headquartered in Taipei, Taiwan, and production is carried out in China, most often using factories of Foxconn, which owns a significant stake in TuL.
The object of the study is the commercially available PowerColor Radeon RX 7900 GRE Hellhound video card with 16 GB of video memory and a 256-bit GDDR6 bus.
| PowerColor Radeon RX 7900 GRE Hellhound 16 GB 256-bit GDDR6 | ||
|---|---|---|
| Parameter | Meaning | Nominal value (reference) |
| GPU | Radeon RX 7900 GRE (Navi31) | |
| Interface | PCI Express x16 4.0 | |
| GPU operating frequency (ROPs), MHz (BIOS OC/BIOS Silent) | 2366(Boost)—2624(Max) / 2293(Boost)—2518(Max) | 2245(Boost)—2605(Max) |
| Memory operating frequency (physical (effective)), MHz | 2250 (18000) | 2250 (18000) |
| Memory bus width, bits | 256 | |
| Number of computational units in the GPU | 80 | |
| Number of operations (ALU/CUDA) in block | 64 | |
| Total number of ALU/CUDA blocks | 5120 | |
| Number of texturing units (BLF/TLF/ANIS) | 320 | |
| Number of rasterization units (ROP) | 160 | |
| Number of Ray Tracing blocks | 80 | |
| Number of tensor blocks | — | |
| Dimensions, mm | 320×147×50 | 300×130×50 |
| Number of slots in the system unit occupied by a video card | 3 | 3 |
| PCB color | black | black |
| Peak power consumption in 3D, W (BIOS OC/BIOS Silent) | 290/270 | 270 |
| Power consumption in 2D mode, W | 22 | 22 |
| Energy consumption in sleep mode, W | 4 | 4 |
| Noise level in 3D (maximum load), dBA (BIOS OC/BIOS Silent) | 22.6/21.1 | 34.0 |
| Noise level in 2D (video viewing), dBA | 18.0 | 18.0 |
| Noise level in 2D (idle), dBA | 18.0 | 18.0 |
| Video outputs | 1×HDMI 2.1, 3×DisplayPort 2.1 | 1×HDMI 2.1, 3×DisplayPort 2.1 |
| Multiprocessor support | No | |
| Maximum number of receivers/monitors for simultaneous image output | 4 | 4 |
| Power: 8-pin connectors | 2 | 2 |
| Power: 6-pin connectors | 0 | 0 |
| Power: 16-pin connectors | 0 | 0 |
| Weight of the card with delivery set (gross), kg | 1.8 | 1.5 |
| Card weight (net), kg | 1.26 | 1.0 |
| Maximum resolution/frequency, DisplayPort | 3840×2160@144 Hz, 7680×4320@60 Hz | |
| Maximum resolution/frequency, HDMI | 3840×2160@144 Hz, 7680×4320@60 Hz |
Memory
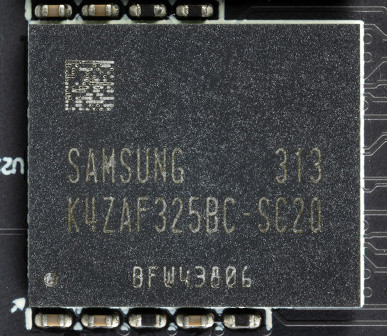
The video card contains 16 GB of GDDR6 SDRAM memory, which is located on the front side of the printed circuit board in the form of 8 chips of 16 Gbit each. Memory chips manufactured by Samsung (model K4ZAF325BC-SC20) are designed to operate at a nominal frequency of 2500 MHz (effective frequency 20000 MHz).
Card features and comparison with Gigabyte Radeon RX 7800 XT Gaming OC 16G (16 GB)

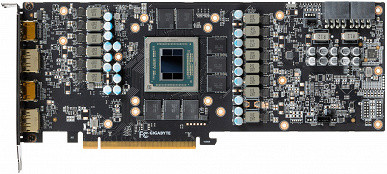
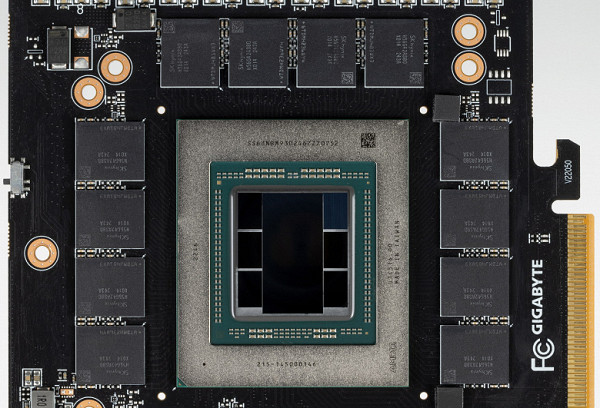
The new product being compared with a card based on the Radeon RX 7800 XT both has a 256-bit memory bus and many common characteristics. Regardless of the manufacturer, they are very similar. However, it is important to note that the Radeon RX 7900 GRE uses the same top-end Navi31 GPU as the Radeon RX 7900 XT/XTX. This means that the chip sizes of the Radeon RX 7800 XT and Radeon RX 7900 GRE are the same, but the crystals on these chips are different. Let's take a closer look at the compact version of Navi31. It was released in the 13th week of 2023, so this solution is already quite old, which is expected for a product introduced in China a year ago.
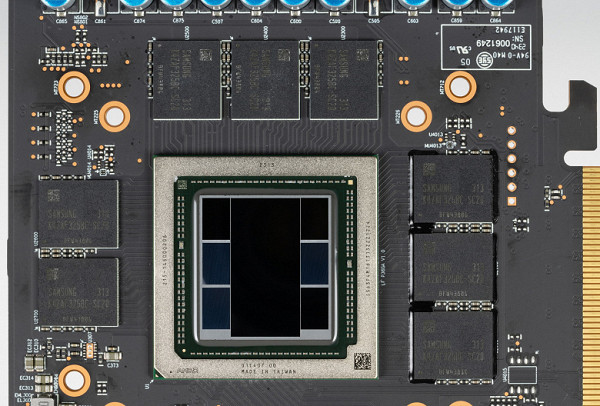
Navi31 у Radeon RX 7900 GRE
Navi31 у Radeon RX 7900 XTX
The photo shows the same Navi31 chip, but with packaging for a 384-bit memory bus, like the Radeon RX 7900 XTX card. Obviously, this pair has the same crystals (chiplets) that form the GPU, but the substrates are very different. The compact version of Navi31 was designed for mobile versions of the Radeon RX 7900 XT/XTX with a 256-bit memory bus, and it is this one that is used in this case, which makes the finished chip size of the Radeon RX 7900 GRE smaller. To ensure compatibility with boards from Radeon RX 7800 XT, Navi31 in a compact version was made pin-compatible with Navi32. Therefore, AMD partners can release almost identical cards based on the Radeon RX 7900 GRE and Radeon RX 7800 XT, without even changing the cooling systems.
The total number of power phases on the PowerColor card is 15 (12+2+1).
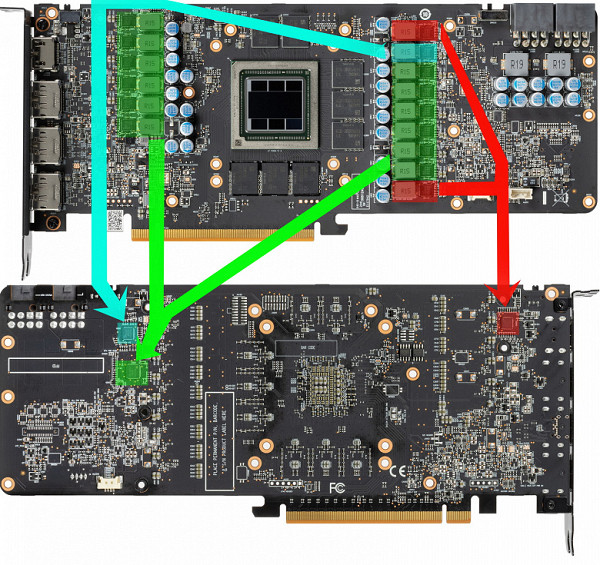
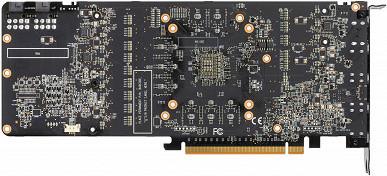
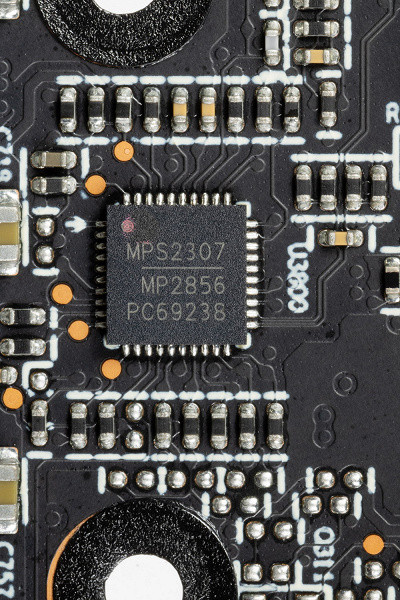
The various components of the power circuit are marked on the graphics card board: green is the power circuit for the core, red is for memory, and blue is for the system on a chip (SoC). All PWM controllers are located on the reverse side of the board.
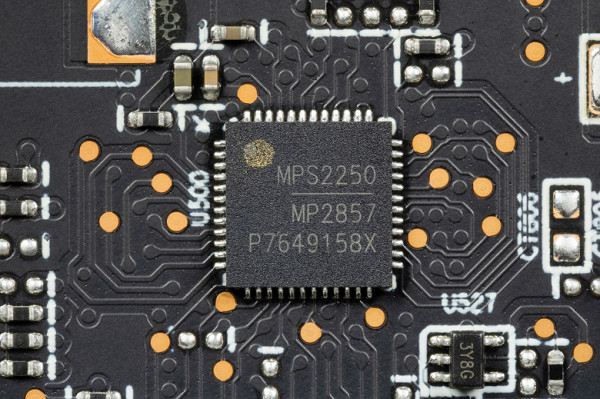
The core is powered by 12 phases, controlled by an MP2857 PWM controller (Monolith Power Systems), which can control up to 12 phases.
The 2 power phases of the memory chips are managed by the MP2856 PWM controller from the same manufacturer.
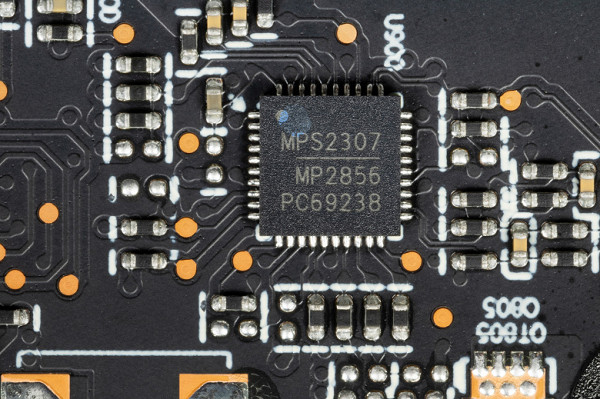
Another controller from the same manufacturer controls the power of the SoC (which is in demand in processors with chiplet architecture).
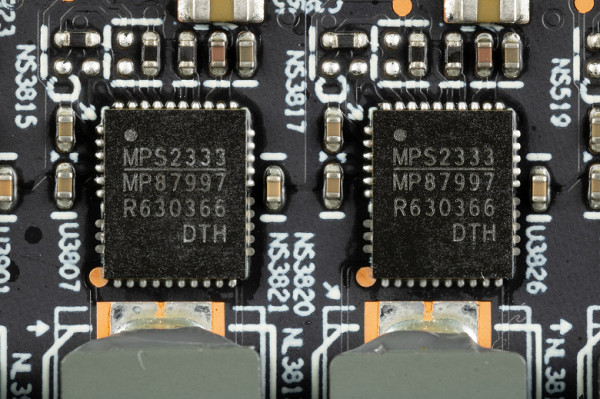
The core power converter uses DrMOS transistor assemblies — in this case MP87997 (Monolith Power Systems), rated for a maximum of 70 A.
The controller for monitoring (monitoring voltage and temperature) is not provided separately: all these functions are integrated directly into the GPU.
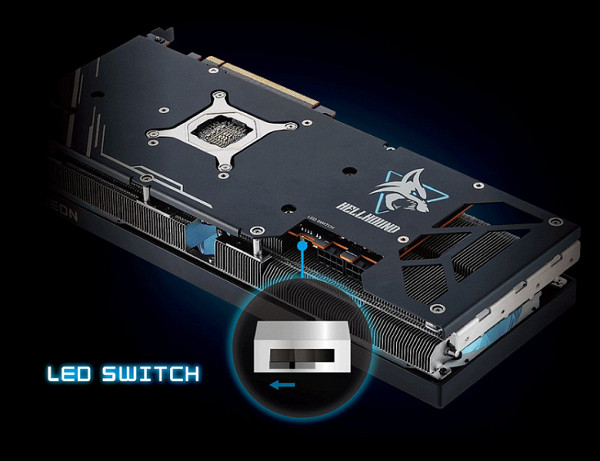
The map backlight is controlled using a three-position switch; There is no digital controller for this purpose.
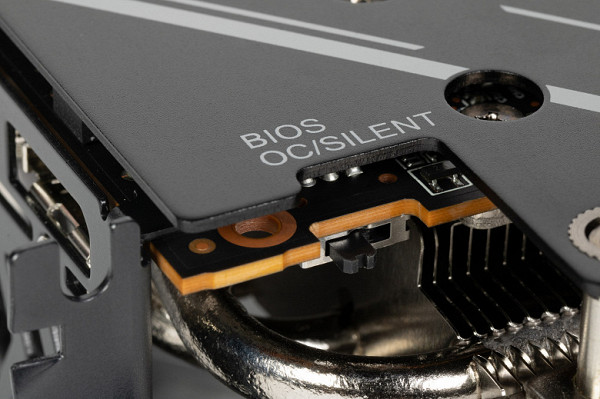
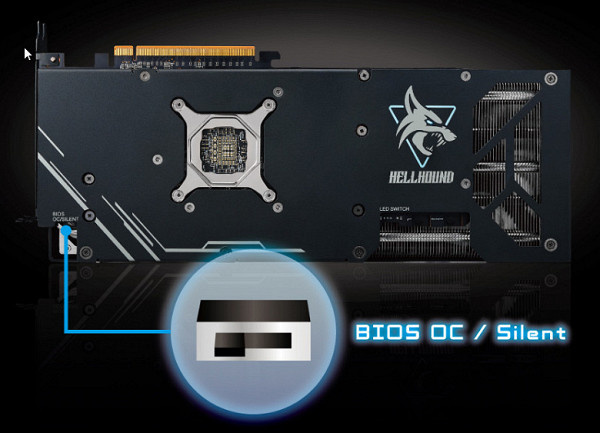
The video card has two operating modes, which are determined by two BIOS options and selected using a switch on the top end of the card: OC (overclocking) and Silent (quiet). The differences between the modes are the fan speed and GPU operating frequencies.
The controller for monitoring (monitoring voltage and temperature) is not provided separately: all these functions are integrated directly into the GPU.
The map backlight is controlled using a three-position switch; There is no digital controller for this purpose.
The video card has two operating modes, which are determined by two BIOS options and selected using a switch on the top end of the card: OC (overclocking) and Silent (quiet). The differences between the modes are the fan speed and GPU operating frequencies.
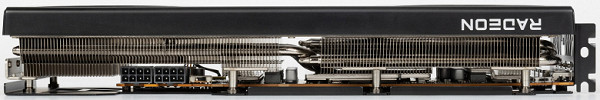
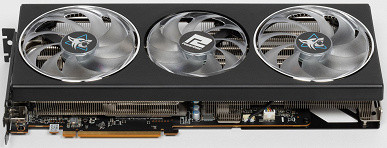
The dimensions of this card are generally standard, the thickness is 5 cm, so it occupies 3 slots in the system unit.
It is also worth noting that the board has the usual 4 video outputs: one HDMI 2.1 and three DP 2.1.
The company does not provide a proprietary utility for managing this card.
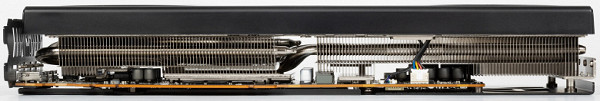
Heating and cooling
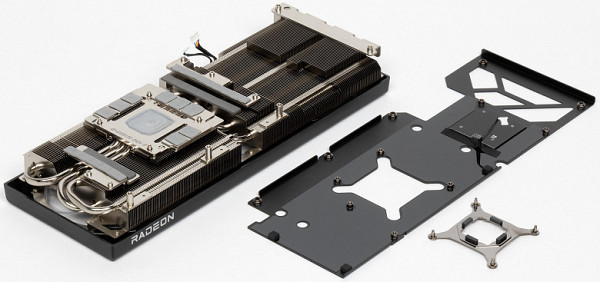
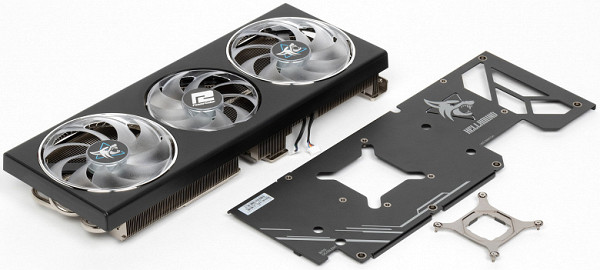
The basis of the CO is a relatively massive multi-section nickel plated radiator with 8 heat pipes that distribute heat along the radiator fins.
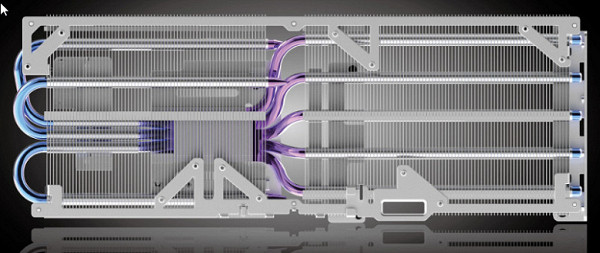
The heat pipes are welded to a large copper radiator. Memory chips are cooled using the same heatsink (through thermal pads). Additional pads on the same heatsink are also used to cool the VRM power converters.
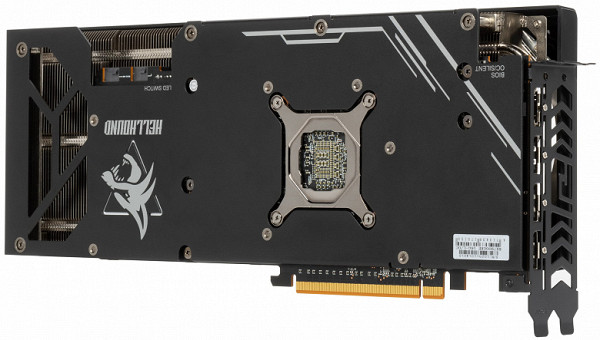
The back plate acts as a protective element for the PCB, giving the structure additional strength, and is also equipped with a backlit series logo.
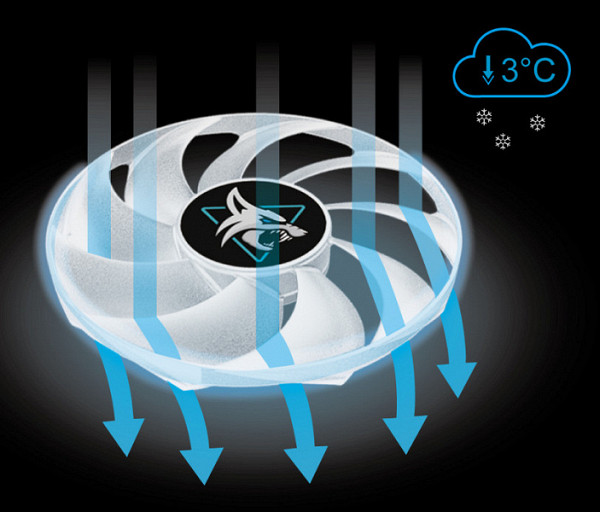
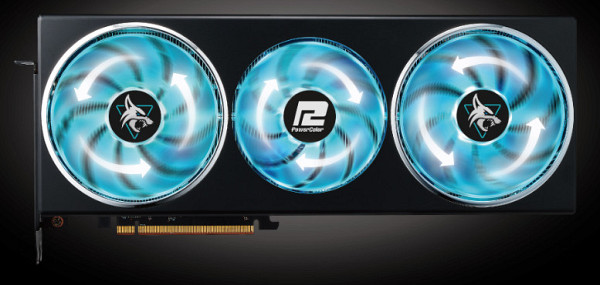
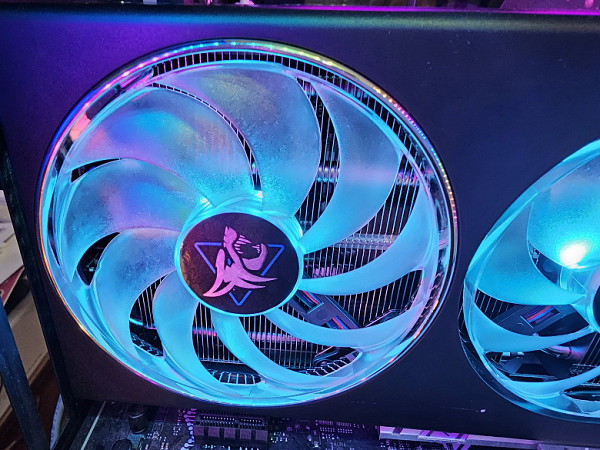
A casing with three fans is installed above the radiator: two outer ones with a diameter of 100 mm and one middle one with a diameter of 85 mm. The fan blades are connected by a ring at the edges. The manufacturer claims that this fan design can further reduce the temperature by 3 degrees.
It is also worth noting the popular technology of rotating the central fan in the opposite direction, which creates a “gear effect” and reduces air flow turbulence.
When the graphics card is under low load, the fans automatically stop if the GPU temperature drops below 50 degrees and the memory chip temperature drops below 90 degrees. After loading the video driver and polling the operating temperature, the fans turn off, even if they were running when the PC started.
Temperature monitoring
BIOS OS mode:
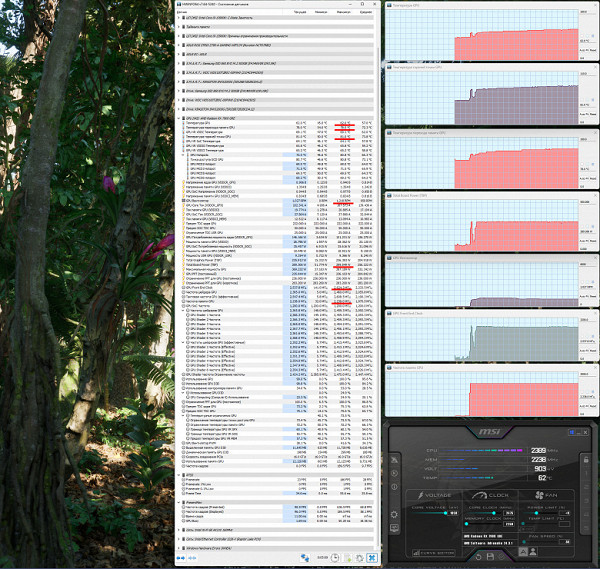
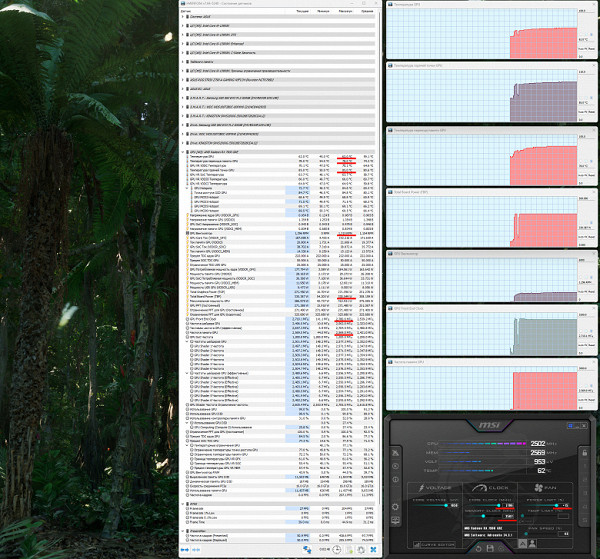
After a 2-hour run under maximum load, the core temperature did not exceed 62 degrees, the highest heating point (hot spot) reached 81 degrees, and the memory chips heated up to 78 degrees. This is an excellent result for a video card of this level. The power consumption of the card reached 290 W. It's important to note that the maximum hot spot temperature allowed is 110 degrees Celsius, which is used by AMD drivers to determine whether the GPU clock needs to be reduced.
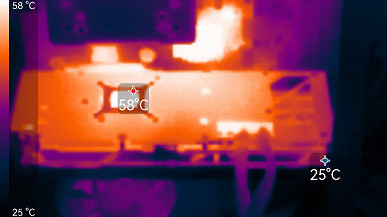
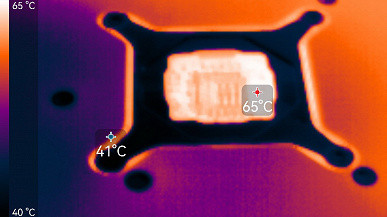
The maximum heating is near the GPU and at the power connector.
We filmed 9 minutes of heating and sped it up 50 times.
When manually overclocked in BIOS OC mode with an increase in the consumption limit by 15%, the heating temperature increased slightly, especially in the hot spot area (62/85/78 °C), a slight increase in noise from the cooling system was also observed, and power consumption increased to 330 W.
BIOS Silent Mode:
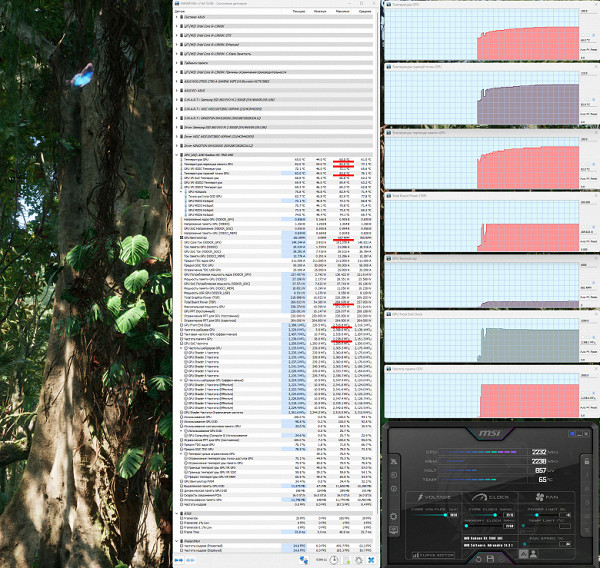
In this case, the maximum core temperature was 65 degrees, and the memory chips heated up to 82°C, which is also a very good indicator for video cards of this level. The card's power consumption was slightly lower (270 W). The maximum GPU hotspot temperature was 83 °C.
Noise
The noise measurement technique assumes that the room where the measurements are taken is soundproofed and attenuated to reduce reverberation. The system unit in which the video card noise is measured does not contain fans and is not a source of mechanical noise. The background noise level is 18 dBA, which corresponds to the noise level in the room and the noise of the sound level meter itself. Measurements are taken at a distance of 50 cm from the video card, at the level of the cooling system.
Measurement modes include:
- Idle mode in 2D: an Internet browser with the site, a Microsoft Word window, and a number of Internet communicators are loaded.
- 2D mode with movie viewing: SmoothVideo Project (SVP) is used — hardware decoding with insertion of intermediate frames.
- 3D mode with maximum load on the accelerator: the FurMark test is used.
The noise level rating is as follows:
- Less than 20 dBA: relatively silent.
- 20 to 25 dBA: very quiet.
- From 25 to 30 dBA: quiet.
- From 30 to 35 dBA: clearly audible.
- From 35 to 40 dBA: loud, but tolerable.
- Above 40 dBA: very loud.
In idle mode in 2D in both BIOS modes, the temperature did not exceed 33 °C, the fans did not rotate, and the noise level corresponded to the background level — 18 dBA.
When watching a movie with hardware decoding, the situation did not change.
BIOS OS mode:
At maximum load in 3D, temperatures reached 62°C for the core, 81°C for the hot spot and 78°C for the memory. The fans reached speeds of up to 1210 rpm, and the noise level increased to 22.6 dBA, which corresponds to very quiet noise.
The noise spectrogram did not show any abnormalities.
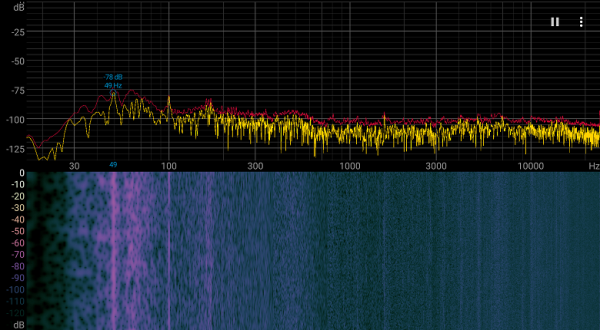
BIOS Silent Mode:
At maximum load in 3D, temperatures reached 65°C for the core, 83°C for the hot spot and 82°C for the memory. At the same time, the fan speed reached 857 rpm, and the noise level increased to only 21.1 dBA, which also corresponds to a very quiet noise level.
Backlight
The video card has illuminated fan impellers and a triangle around the series logo on the back.
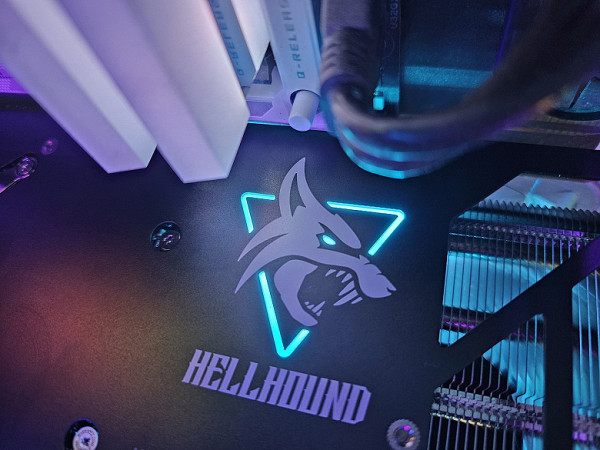
The backlight is controlled exclusively in hardware using a three-position switch at the end of the card. The user can choose one of three backlight modes: blue, off or lilac (the manufacturer also calls it amethyst). The backlight operates in single-color mode.
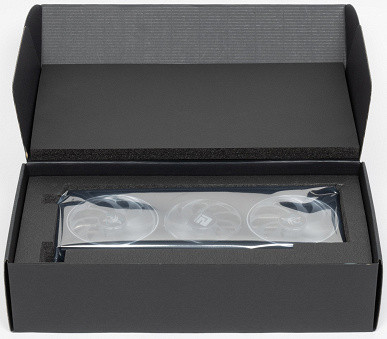
Delivery and packaging
Apart from the card itself, there is nothing else included in the package.
Testing: synthetic tests
We've expanded our suite of synthetic benchmarks with new examples covering compute, ray tracing, and resolution scaling technologies. However, some tests, such as DirectX 11 and 12 applications from various SDKs, have been excluded due to incorrect results they have been producing recently.
In synthetic tests, we compared the performance of several graphics cards, including the Radeon RX 7900 GRE, RX 7900 XT, RX 7800 XT, GeForce RTX 4070 Super and GeForce RTX 4070. To analyze the performance of the RX 7900 GRE, we used current-generation Radeon models based on the RDNA3 architecture, such as the RX 7900 XT and RX 7800 XT, to understand in which scenarios it performs better or worse.
In addition, for comparison we chose two modern GeForce video cards — RTX 4070 and RTX 4070 Super. Although the pricing of these cards is slightly different from the RX 7900 GRE, they are still its direct competitors. This comparison allowed us to identify the strengths and weaknesses of the RX 7900 GRE and determine how well it performs compared to similarly priced video cards.
3DMark Vantage tests
We continue to use legacy synthetic tests from the 3DMark Vantage suite, such as Feature tests, because they can still provide useful information that newer tests do not. For example, Feature tests support DirectX 10 and can help analyze the performance of new video cards.
One such test is Feature Test 1: Texture Fill, which measures the performance of texture fetch blocks. It is based on filling a rectangle with values read from a small texture using multiple texture coordinates that change every frame.
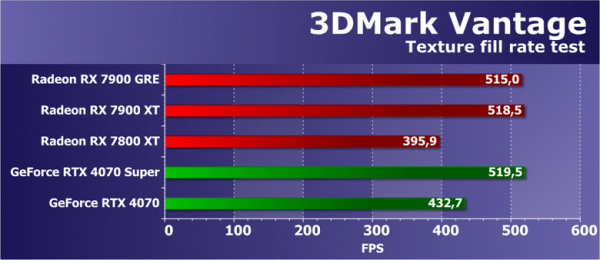
The performance of AMD and Nvidia video cards in Futuremark's texture test is usually quite high, and the test results are usually close to the corresponding theoretical parameters. However, sometimes they can be slightly low for some GPUs. In the case of the Texture Fill test, the performance of the most stripped-down version of the Navi 31 GPU turned out to be quite high, showing results almost on par with the current generation RX 7900 XT. However, the younger model with a weaker GPU lagged behind — which is in line with expectations.
A comparison of the video card in question with its competitors also shows good results. The effective texturing speed of the new Radeon family has decreased slightly, which has already been observed in tests of the RX 7000. The youngest of the Radeon 7900 family demonstrated results at the level of the RTX 4070 Super video card, which is a good indicator, considering that the latter is a more expensive option. Previously, AMD solutions were stronger in this subtest.
Feature Test 2: Color Fill
This test measures how quickly the screen fills. It uses a simple, non-performance-limiting pixel shader and writes the interpolated color value to an off-screen buffer using alpha blending. The test uses a 16-bit off-screen buffer in the FP16 format, which is relevant for games with HDR rendering, making it modern and relevant.
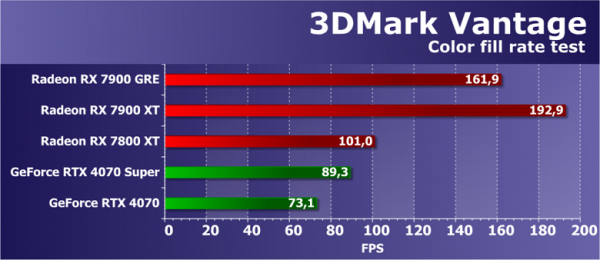
The results of the second subtest of 3DMark Vantage allow us to evaluate the performance of ROP units without taking into account the amount of video memory bandwidth. The test specifically measures the performance of the ROP subsystem, and the impact of bandwidth is usually negligible. In this regard, the results of the Radeon RX 7900 GRE video card are slightly inferior to the older model on a less stripped-down version of the same GPU, and in terms of the speed of the ROP subsystem, the GRE model lags further behind than in the previous test. However, it is still ahead of the RX 7800 XT, despite having fewer ROPs.
A comparison with the GeForce RTX 40 series video cards shows their noticeably lower performance, close to almost the level of the RX 7800 XT. Therefore, the RX 7900 GRE has no problems with them — the GeForce RTX 4070 Super is almost half behind, and the less expensive RTX 4070 is even further behind the similarly priced AMD video card. Despite this, Nvidia video cards have always been inferior to their competitors in terms of peak scene fill rate, so such results in this subtest are not surprising.
Feature Test 3: Parallax Occlusion Mapping
This test is one of the most interesting feature tests, since the Parallax Occlusion Mapping technique has been used in games for a long time. The test draws a single quadrilateral using a sophisticated Parallax Occlusion Mapping technique to simulate complex geometry. This requires resource-intensive ray tracing and the use of a high-resolution depth map, as well as surface shading using a heavy Strauss algorithm. The test evaluates the performance of a pixel shader GPU performing multiple texture fetches during ray tracing, dynamic branching, and complex Strauss lighting calculations.
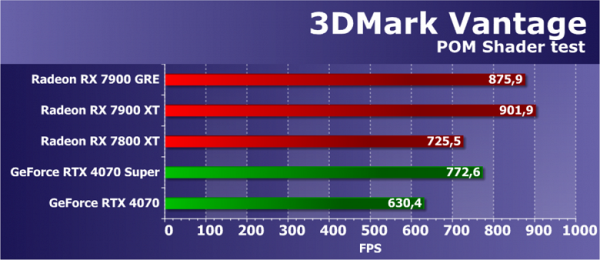
The results of this test from the 3DMark Vantage package depend not only on the speed of mathematical calculations, branching efficiency or texture fetch speed, but also on several parameters simultaneously. To achieve high speed in this task, the correct balance of the GPU is important, as well as the efficiency of executing complex shaders. This test is useful because its results often correlate with performance in gaming tests.
Both math and texture performance are important in this task, with memory bandwidth playing a less significant role. The Radeon RX 7900 GRE showed a very good result, almost at the level of the older model in the family, and was ahead of the RX 7800 XT. Both main competitors in the form of video cards GeForce RTX 4070 and RTX 4070 Super also ended up behind, which speaks in favor of GRE.
Feature Test 4: GPU Cloth
This test is interesting because it calculates physical interactions (fabric simulation) using the GPU. For this, vertex simulation is used, the combined work of vertex and geometry shaders with several passes, as well as stream out to transfer vertices between simulation passes. The test evaluates the execution performance of vertex and geometry shaders, as well as stream out speed.
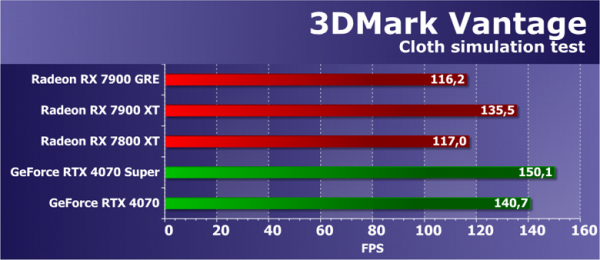
The rendering speed in this test also depends on several parameters, the main ones being geometry processing performance and geometry shader execution efficiency. Despite the strengths of Nvidia chips, the results in this test have long been incorrect due to obvious problems with driver optimization for both Nvidia and Radeon video cards. Therefore, it makes no sense to take into account the results of all GeForce and Radeon video cards in this test.
Feature Test 5: GPU Particles
This test focuses on the physics simulation of effects based on particle systems that are calculated by the GPU. A vertex simulation is used, where each vertex represents an individual particle. Stream out is also used to transfer data between passes. The test calculates a large number of particles, animates them and takes into account collisions with the height map. Particles are rendered using a geometry shader that generates particles from each point. This test loads the shader units with vertex calculations and also tests stream out.
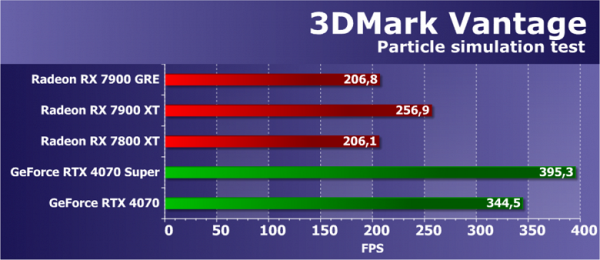
In the second 3DMark Vantage geometry test, the new AMD video card showed results that were far from expected, but closer to reality compared to the previous test of this benchmark. If we accept the results as correct, then the AMD video card is inferior to everyone except its junior model — it is closer to the RX 7800 XT, and the RX 7900 XT is slightly faster. In this test, all Radeon graphics cards are inferior to both competitors, and the RTX 4070 Super is almost twice as fast as GRE, which can be explained by the varying degrees of driver optimization for this task.
Feature Test 6: Perlin Noise
The last feature test from the Vantage package is a mathematically intensive GPU test. It calculates multiple octaves of Perlin noise in the pixel shader, with each color channel using its own noise function to increase the load on the GPU. Perlin noise is a standard algorithm widely used in procedural texturing and requires a significant amount of mathematics.
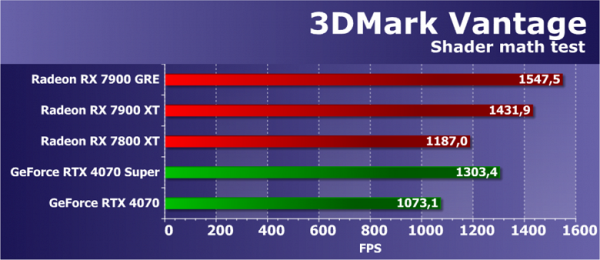
In this mathematical test, the performance of all solutions, although not entirely in line with expectations, is usually close to the peak performance of video chips in critical tasks. The test uses floating point operations, and the new Ada Lovelace and RDNA3 architectures should have revealed some of their unique capabilities by running the corresponding commands twice, but this test is already outdated and is not fully capable of showing the new capabilities of modern GPUs, judging by the comparative results.
It’s surprising that the GRE model is ahead of the older video card of the family, the Radeon RX 7900 XT, which seems incorrect. However, the fact that it outperformed the younger model RX 7800 XT is quite logical, and the small difference between them also indicates the influence of memory bandwidth on the results. More importantly, the Radeon RX 7900 GRE we're reviewing today also beats out its competitors in the form of the RTX 4070 and RTX 4070 Super, with the latter model being even more expensive. Let's see what more modern synthetic tests that use increased GPU load will show.
Direct3D 12 tests
We excluded from our tests examples from Microsoft's DirectX SDK and from AMD's SDK that use the Direct3D12 graphics API. Basically, they have been showing incorrect results for a long time. As the only computational test with Direct3D12 support in this section, we left the well-known Time Spy benchmark from 3DMark. In it, we are interested not only in a general comparison of GPU power, but also in the difference in performance when asynchronous computing available in DirectX 12 is enabled and disabled. For reliability, we tested the video cards in two graphics tests simultaneously.
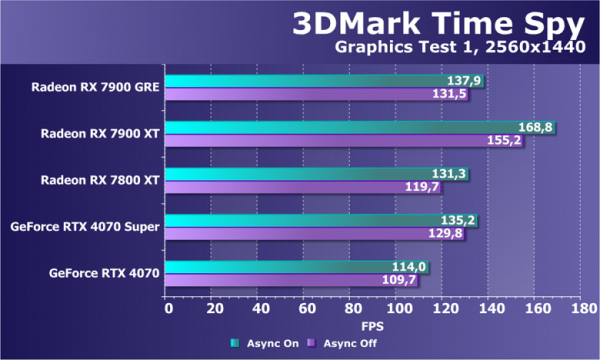
In this test, Radeons always look better than GeForces in terms of price and performance. And in this case, the Radeon RX 7900 GRE outperformed not only its competitor with a lower price, but also outperformed the expensive model — GeForce RTX 4070 Super, which turned out to be very close to the GRE.
However, compared to other current-generation Radeon video cards, the situation is not so clear-cut. Memory bandwidth is important in this test, which is why the RX 7900 GRE isn't much ahead of the RX 7800 XT, while the RX 7900 XT is ahead of both mentioned models. This indicates that the performance of the graphics card in question may be unstable and it may perform differently in different games.
Ray tracing tests
One of the first ray tracing performance tests is the Port Royal benchmark from the creators of the famous 3DMark series. This test is available on all video cards that support the DirectX Raytracing API. We tested it on several video cards at 2560x1440 resolution and different settings. The test uses two ray tracing modes to calculate reflections, as well as the traditional rasterization method.
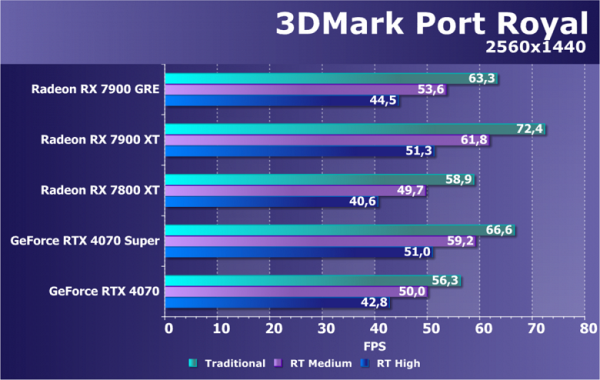
The Port Royal benchmark demonstrates new ray tracing capabilities through the DXR API, including algorithms for rendering reflections and shadows. However, the test is not optimized properly and stresses the GPU, including powerful models. Despite this, it is well suited for comparing the performance of different video cards in a given task.
The test results clearly demonstrate the differences in AMD's and Nvidia's approaches to hardware-accelerated ray tracing support. Although the RDNA3 architecture slightly improves AMD's position, the GeForce RTX 4070 Super is still faster, on par with the RX 7900 XT. Overall, the Radeon RX 7900 GRE is approximately halfway between solutions based on Navi 31 and 32, which is in line with expectations.
Later, another subtest of 3DMark was released that focused on ray tracing performance — DirectX Raytracing. Unlike the previous one, this test does not use rasterization, but only ray tracing, which better reflects the speed of the GPU in this area. The scene in this benchmark is already familiar from other 3DMark tests and is quite compact — the BVH structure is theoretically placed in the Infinity Cache, which may be useful for Radeon video cards.
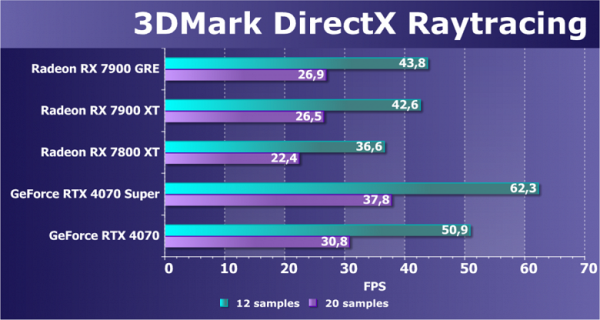
In this test, RDNA3 performed even better at ray tracing, but the difference in approach between AMD and Nvidia is still significant. The RX 7900 GRE is ahead of the RX 7800 XT and slightly behind the RX 7900 XT, which is in line with expectations given the priority of computing performance. However, even the lower-end Ada Lovelace model, the RTX 4070, turns out to be slightly faster than GRE, which may be somewhat unexpected.
It is important to remember that this is a synthetic test and may not fully reflect real-life gaming conditions. Most ray tracing games will put less load on the RT units, which could benefit the Radeon RX 7900 GRE. However, in this test, Nvidia graphics cards still remain ahead thanks to dedicated RT cores, which are more versatile and maintain performance when ray tracing is enabled.
In addition, with the release of new generations of Nvidia and AMD GPUs, another test with a serious load on ray tracing was added to the 3DMark package — Speed Way. This test is closer to real gaming conditions and is interesting for assessing GPU performance in games that actively use ray tracing.
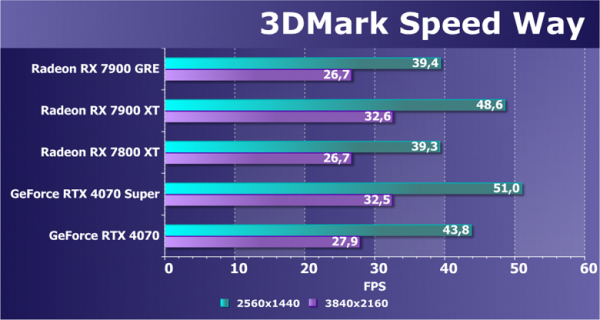
Once again, we see significant differences in results between Radeon video cards. Memory bandwidth turned out to be a key factor in this test, as the RX 7900 GRE performed comparable to the RX 7800 XT, while the lag behind the RX 7900 XT was significant. The difference between Radeon and GeForce remains, but has decreased, since the AMD video card in question is not so much inferior to its younger competitor in price, the RTX 4070. This fact can be considered a success for AMD.
Let's consider another benchmark, which is a semi-synthetic test, but based on a real game engine. Boundary is a Chinese game project that supports DXR and DLSS technologies. The GPU load is very high in this benchmark as ray tracing is heavily used for complex reflections, soft shadows and global illumination. Unfortunately, we are unable to use DLSS technology in our Radeon tests.
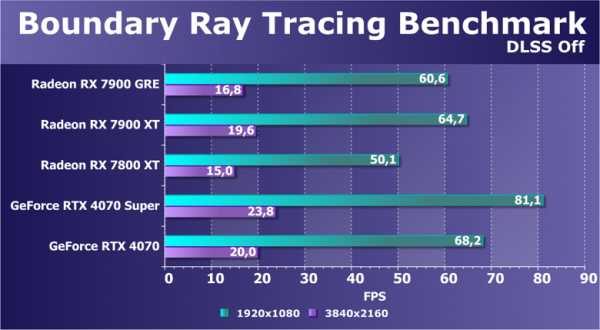
Even in Full HD resolution, only powerful video cards can provide acceptable performance without using resolution scaling technologies. The model we're reviewing today, the RX 7900 GRE, delivered frame rates at comfortable levels. However, at 4K resolution even the RX 7900 XT struggles. Although the RX 7900 GRE lags behind both GeForce graphics cards presented in the comparison, including the RTX 4070, which costs less, it still beats the RX 7800 XT on the lower-end chip and is significantly closer to the older solution based on Navi 31.
Computational tests
We continue to look for benchmarks that use OpenCL for modern computing tasks to include in our synthetic benchmark suite. At the moment in this section we have a rather old and not very optimized ray tracing test — LuxMark 3.1. This cross-platform benchmark is based on LuxRender and uses OpenCL.
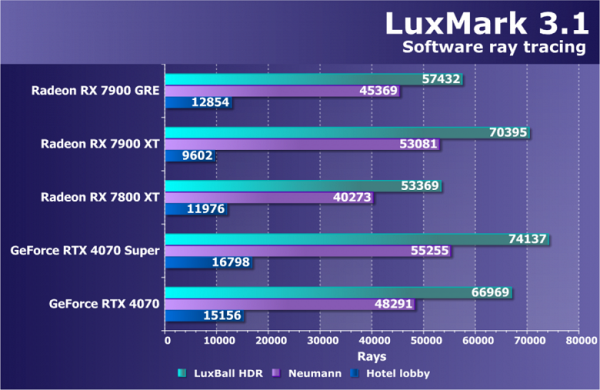
The Radeon RX 7900 GRE, built on a stripped-down version of the Navi 31 GPU, performed well compared to the RX 7800 XT from the same generation, which is quite expected. However, compared to the more powerful RX 7900 XT, GRE is inferior in some tests — this is likely due to bandwidth limitations. In particular, the RX 7900 XT performed slowly on the most difficult test, which we tested repeatedly. Overall, the results of the AMD graphics card were lower compared to competitors, including even the more affordable RTX 4070, not to mention the Super version.
Unfortunately, the V-Ray Benchmark, which tests the ray tracing performance of GPUs without hardware acceleration, does not work on new AMD graphics cards. However, Maxon recently released Cinebench 2024, an updated version of the popular 3D rendering benchmark. Cinebench 2024 uses a photorealistic scene and is based on the Redshift rendering engine, which is also used in the Cinema 4D program. This benchmark allows you to evaluate the hardware capabilities of both the processor and the video card, using the same algorithms and scenes for testing the CPU and GPU.
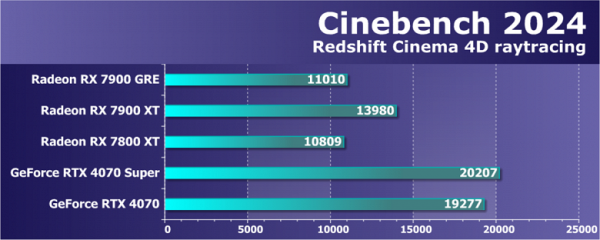
In today's test, the Radeon RX 7900 GRE graphics card didn't perform too impressively—the memory- and cache-reduced model barely outperformed its Navi 32-powered little sister, and both were outperformed by the RX 7900 XT. This confirms the importance of PSP in this test. If we add two competing GeForce video cards into the comparison, we see that AMD solutions are not in the lead — even the RTX 4070 outperformed the RX 7900 XT. It seems that increasing the rate of instruction issuance in the new RDNA3 graphics architecture does not provide a noticeable increase in performance in this test, and despite the high theoretical performance, solutions based on the new architecture do not perform as well as expected in practice.
Tests of DLSS, FSR, XeSS technologies
In this section, we explore additional tests related to performance improvement techniques. Previously, these were resolution scaling technologies (DLSS 1.x and 2.x, FSR 1.0 and 2.0, XeSS). Now let's jump straight into XeSS, since DLSS only works on Nvidia GPUs, and today we're looking at a Radeon video card.
XeSS is a method of increasing performance by rendering at a lower resolution and upscaling the image to a higher one. This is an analogue of DLSS 2.0 from Intel, which also uses artificial intelligence to restore details in the frame. The difference is that XeSS runs on all modern GPUs, although not as efficiently as on Intel graphics cards. For testing, we used a specialized benchmark from the 3DMark package.
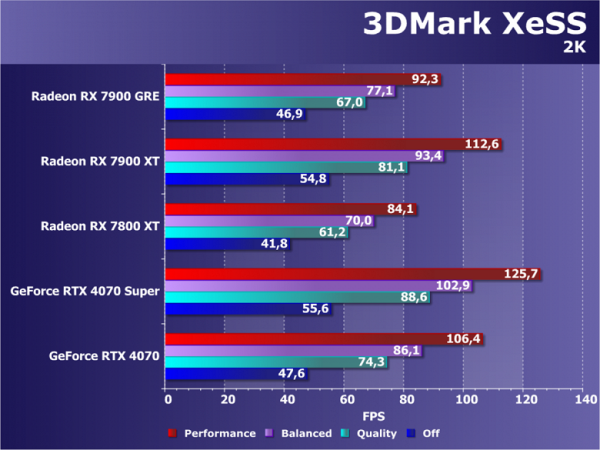
Enabling XeSS results in a significant increase in frame rates — up to two times or more. Given the versatility of this technology, it's worth a look, as each of the three companies has their own performance enhancement methods, each with their own advantages and disadvantages: DLSS is advanced, but limited only to Nvidia GPUs; FSR is generic, but less advanced and does not use dedicated acceleration units; XeSS offers versatility, but still lags behind DLSS in quality and functionality.
In the test, the Radeon RX 7900 GRE video card showed approximately the same efficiency as previous generation video cards, similar to other current generation models. GRE is again closer to the RX 7800 XT than the RX 7900 XT, highlighting the importance of memory bandwidth. Nvidia video cards demonstrate comparable efficiency to AMD, and only Intel solutions do a little better due to specialized units. It's surprising that the RX 7900 GRE couldn't even beat the RTX 4070, let alone the RTX 4070 Super, which was faster in the test.
Another representative of rendering scaling technology is FSR 2.0 from AMD. For some unknown reason, this particular technology became the last one in the list of specialized 3DMark subtests. The stages of different scaling technologies are different, so they cannot be compared directly, only in terms of performance gains. It is also important to take into account the actual rendering resolution and quality differences, which require separate consideration.
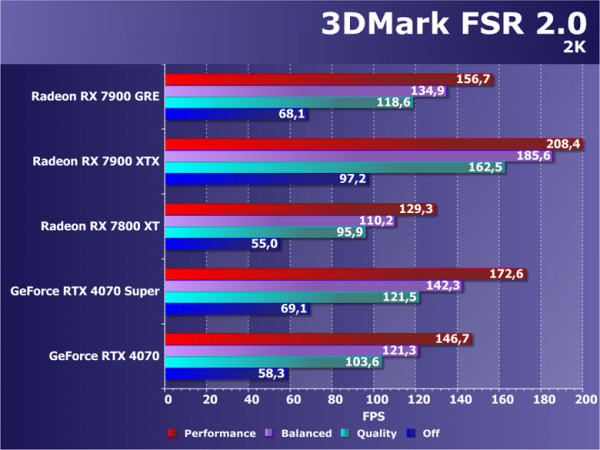
FSR is another universal technology that demonstrates approximately the same efficiency on different GPUs. In the FSR 2.0 tests, the GPU results were in about the expected order, with the RX 7900 GRE positioned between the RX 7800 XT and RX 7900 XTX (not the XT in this test), which is as expected. It is important to note that the GRE outperforms the RTX 4070 in all subtests and sometimes even comes close to the RTX 4070 Super, which is also expected from a theoretical point of view.
As expected, the scaling technology tests didn't reveal anything particularly out of the ordinary, and the RX 7900 GRE performed as expected compared to other Radeon graphics cards and competing GeForce models. The next step is to test the new AMD graphics card in real gaming conditions to confirm or refute our conclusions based on synthetic tests.
Testing: gaming tests
- Computer based on Intel Core i9-13900K processor (Socket LGA1700) :
- Platform:
- Intel Core i9-13900K processor (overclocked to 5.4 GHz on all cores);
- ZhSO Cougar Helor 360;
- Asus ROG Strix Z790-A Gaming WiFi D4 motherboard based on the Intel Z790 chipset;
- RAM TeamGroup Xtreem ARGB White (TF13D416G5333HC22ADC01, CL22-32-32-52) 32 GB (2×16) DDR4 5333 MHz;
- SSD Intel 760p NVMe 1 TB PCIe;
- SSD Intel 860p NVMe 2 TB PCIe;
- ThermalTake Toughpower GF3 1000W power supply ;
- Thermaltake Level20 XT case;
- operating system Windows 11 Pro 64-bit;
- TV LG 55Nano956 (55″ 8K HDR, HDMI 2.1);
- AMD drivers version 24.3.1;
- Nvidia drivers version 551.86;
- Intel drivers version 101.5379;
- VSync is disabled.
- Platform:
3D gaming performance in a nutshell
Games without ray tracing (classic rasterization):
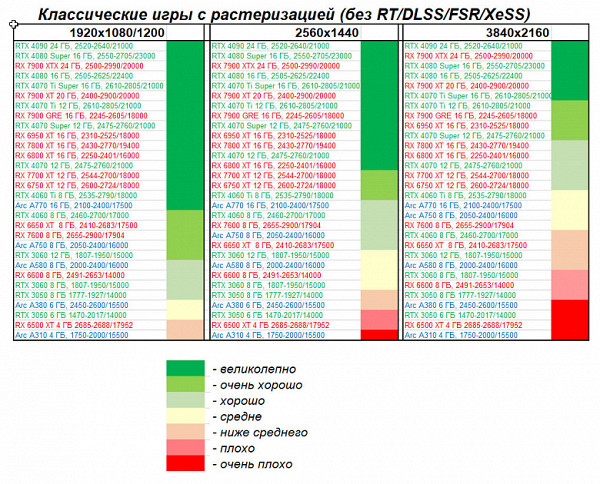
In games that don't use ray tracing, the Radeon RX 7900 GRE delivers excellent gaming experience at resolutions ranging from 1080p to 2160p (4K). It is superior to the previous generation flagship Radeon RX 6950 XT and is capable of replacing both it and the Radeon RX 6900 XT. The new accelerator competes with the GeForce RTX 4070 Ti and GeForce RTX 4070 Super.
Games using ray tracing and DLSS/FSR/XeSS:
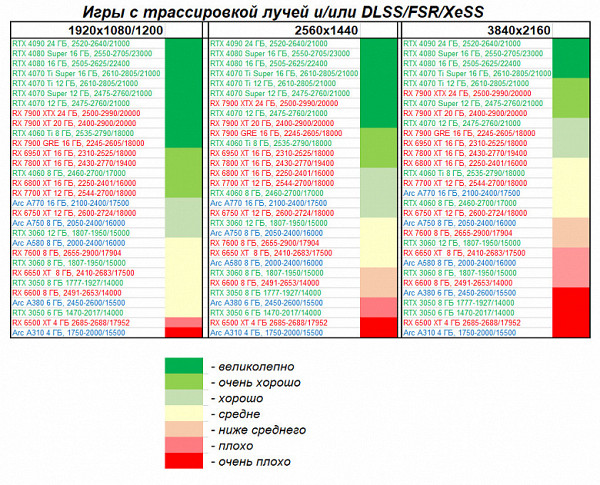
In games that support RT and resolution scaling technologies such as DLSS/FSR/XeSS, the Radeon RX 7900 GRE provides full gaming comfort only at 1080p and 1440p resolutions. In 4K you will have to resort to compromises. However, the Radeon RX 7900 GRE is once again ahead of the previous generation of Radeon RX 6950 XT and Radeon RX 6900 XT graphics cards, demonstrating its readiness to completely replace them. Compared to Nvidia cards, it competes only with the GeForce RTX 4060 Ti and at best reaches the level of the GeForce RTX 4070. However, with the advent of mass releases of games with FSR 3 support, the situation for the Radeon RX 7900 GRE and all modern AMD video cards may improve.
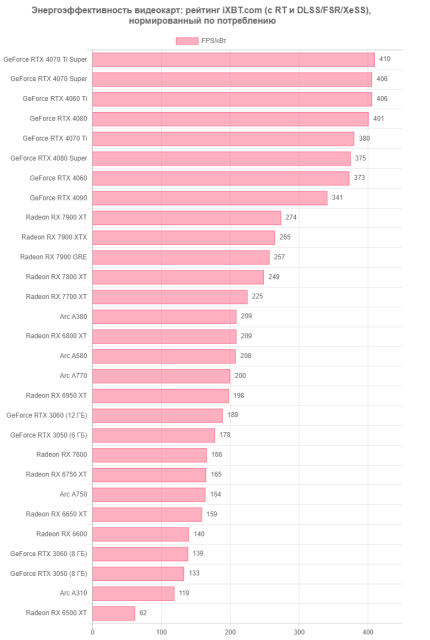
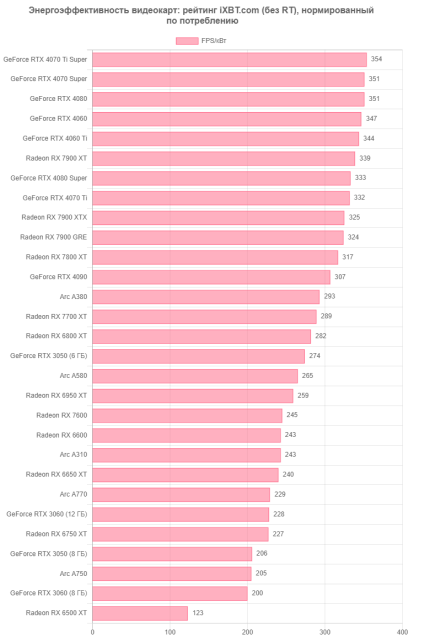
Conclusions and comparison of energy efficiency
Radeon RX 7900 GRE (16 GB) is a new AMD graphics accelerator with an unusual name. Perhaps it should be called simply Radeon RX 7900, which would be more logical and understandable for users. However, even with this name there is confusion: is GRE weaker than XT, or vice versa? Despite this, users will probably be able to figure it out, similar to how they distinguish between Nvidia's Ti and Super models. However, such a case will probably remain isolated.
Regardless of the name, such an accelerator is in great demand, since a significant distance has appeared between the Radeon RX 7900 XT and the Radeon RX 7800 XT, which is already difficult to fill with solutions based on the previous flagship Radeon RX 6950 XT. Almost the entire Radeon RX 7000 family of graphics cards is in need of a price adjustment, especially given the success of competitive DLSS 3 technology, which is becoming more common. The introduction of similar FSR 3 technology should improve the position of AMD accelerators, but so far this is happening slowly.
In games without RT, the Radeon RX 7900 GRE occupies an intermediate position between the GeForce RTX 4070 Ti and GeForce RTX 4070 Super, rather approaching the latter. However, in games with RT and scaling technologies, it is much inferior, and the GeForce RTX 4070 Super becomes a more attractive option, despite the lower memory capacity (12 GB versus 16 GB for the Radeon RX 7900 GRE). Fans of AMD solutions can only expect price reductions.
What also works against new AMD products is that the already released video cards of the Nvidia GeForce RTX 40 family have seriously reduced the prices of previous generation solutions, including the GeForce RTX 40 themselves. Thus, the situation for the Radeon RX 7900 GRE (and Radeon RX 7800 XT) is now causing certain difficulties .
At the time of preparing our review, sales of the Radeon RX 7900 GRE had already begun, and we draw conclusions based on real prices from marketplaces. However, as we noted earlier, these prices are clearly inflated. We hope that the introduction of FSR 3 into games will help change this situation.
When it comes to energy efficiency, the GeForce RTX 4070 Super is in the lead, while the Radeon RX 7900 GRE is still far behind it.
Like the older models in the line, the Radeon RX 7900 GRE is also based on the modern RDNA3 architecture and uses the same Navi31 GPU as the more powerful models.
We also note that the image output subsystem has been improved throughout the Radeon RX 7000 series. The reviewed video card is equipped with DisplayPort 2.1 UHBR13.5 connectors, which is an advantage over GeForce cards, which are limited to the DisplayPort 1.4a standard. This allows you to stream 4K resolution at 240Hz without streaming compression through a single cable. In addition, the hardware capabilities for encoding and decoding video data on this card do not differ from more powerful models, including full support for the AV1 format.
The PowerColor Radeon RX 7900 GRE Hellhound (16 GB) card that was tested has standard dimensions and occupies three slots in the system unit. Its cooler used is efficient and very quiet. The maximum power consumption of the card can reach 290W, and it is equipped with two standard 8-pin power connectors.
The manufacturer provides a 3-year warranty on this card.
We emphasize once again that the Radeon RX 7900 GRE is ideal for gaming at 1080p and 1440p resolutions at maximum graphics settings, including ray tracing with FSR/XeSS support. It also handles 4K gaming well under similar conditions. In games without RT support, you will get excellent gaming experience in all three mentioned resolutions.